Monthly Precious Metals Technical Analysis Report - September 2020
07 October 2020
Gold – In Brief
To read the full report in PDF format, please click here.
Gold dropped in September after the new high in August, and the ‘indecisive’ monthly candlestick formed in August. The proximate cause of the decline was the broad-based rally in the US Dollar (the ‘DXY’) after the DXY become technically oversold, and the non-commercial sector bought back around 800 million shorts in the first three weeks of September.
The enhanced messaging from the Federal Reserve had a very brief impact with yields rallying on the news, but then ranging between 0.60-0.73 subsequently. As noted above the Dollar commenced a strong climb almost immediately after the ‘lower for longer’ message embedded in the Fed’s average inflation target policy announcement.
US five year forward inflation estimates rose, breaking above the down trend with a successful re-test of the line.
In essence, the re-statement or extension of Fed policy didn’t change the narrative or expectations during the month of September, and gold fell.
At the end of the month the President of the St. Louis Fed, James Bullard delivered a very upbeat opinion on the expected Q3 GDP performance in the US, anticipating +35%, against market consensus of 25% growth. Bullard is of the belief that the powerful stimulus package has done enough to secure a recovery in 2020, again not a consensus outlook.
As we enter October with Congress wrangling over the terms of a Pandemic stimulus package, gold is taking a shine to the lack of a bi-partisan agreement. Democrats in the House of Representatives have voted through a US$2.20 trillion stimulus package, but it lacks bi-partisan support and looks certain to fail in the Upper House, which has Republican senators in 53 out of 100 seats. US Personal incomes fell by 2.70 pct in August.
Since then, President Trump has fallen ill with Coronavirus, although seems to be recovering. Some wonder whether there would be a benefit to the President in terms of polling?
Assumptions that there might be a poll improvement are based on UK polling after the UK PM contracted Covid, however the UK Opposition leader was arguably establishing his role in March and Boris Johnson’s stay in hospital coincided with the early phase in the spread of the pandemic, not the increasing wave seen now in both the US and the UK.
Since then, the President has halted fiscal stimulus discussions – which makes me suggest James Bullard’s predictions about economic recovery through Q4 are now less likely to come good.
Money and Interest Rates
Inflation-linked yields slightly higher, helping explain the weaker performance during September. Five year forward inflation estimates are rising to just shy of the 2020 high of 1.89 pct.


Quick Overview of Managed Money Positioning in Gold
Gold in the week to the 29th of September saw a week of light liquidation by longs and buying back from the short sellers. Between the 29th September and the 5th of October, total Open Interest on the COMEX gold contract increased slightly, which may imply more longs returning to the market, given the slight rally between those dates.

Gold Positioning and Volume-Weighted Average Pricing
A net outflow during September. ETFs remained strong but futures shrank as Managed Money longs took advantage of some great prices to reduce their holdings. Later they tried to re-join the market but appear to be quite sensitive and defensive, based on the rapid exit in the week ending Tuesday the 22nd of September.
ETFs ended September long 110,654,738, a 27.740 million increase during the year.

Weekly Ichimoku Cloud Chart
Support mentioned in the Weekly Wrap materialised although the US$1838 level wasn’t truly tested. Gold got within a few dollars of the green Standard line and turned around.
Support at the Standard Line, the 23.60 pct Fibonacci retracement of the August 2018-August 2020 and March–August 2020 moves. Still bullish although the huge pull away from the Cloud means there is scope for some serious falls in price.

Daily Ichimoku Cloud Chart
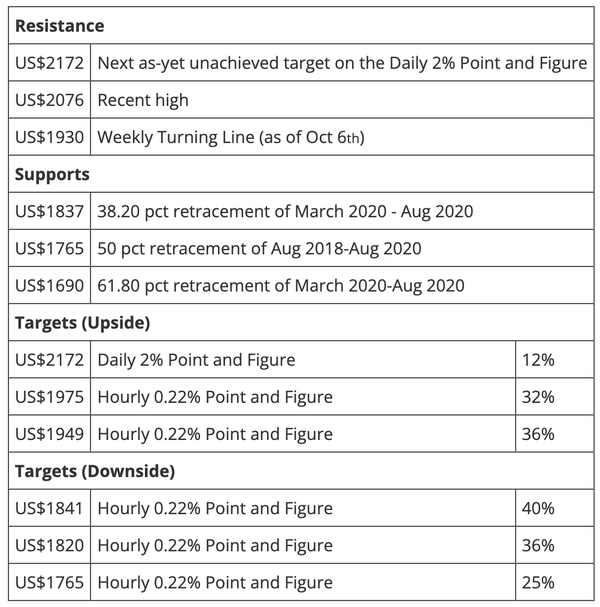
The price broke down through the Daily cloud base, which means the immediate trend has turned negative, compared with the long-term trend which is still very strongly bullish. Short term resistance at US$1921 from the Standard Line proved powerful, that level has dipped now to US$1911. Further resistance at US$1958 from the Daily Cloud top.
Below the Daily cloud, look to Point and Figure for targets, which suggest just sub US$1870 and for the medium term, a possible test of the 61.80 pct retracement at the orange line below the current price levels?

Gold Hourly Point and Figure – Medium Term
Medium term chart targets that just turned negative – possible look again at US$1840-44?

Price Targets via Point and Figure – Short Term
After being pushed back lower and after interacting with the Daily cloud, a small host of downside targets are rapidly playing out. Below US$1870 I suspect the market will cycle higher again.

Gold-Silver Ratio
Plenty of targets suggesting that silver will outperform after the recent drop.
A strong band of resistance at 70, however.

Silver in USD
The macro view of silver. Both the Weekly Standard line and the 38.20 pct Fibonacci retracement have been key supports so far but beware the risk of a move to the 61.80 pct retracement of the March – August move.

Silver in AUD – Hourly Point and Figure
As mentioned in the Monthly Review, here are the targets for the XAGAUD. Although recent price action has turned bearish, there are targets back to A$36/37 plus for Aussie silver.

Equities - the SPX
The Index closed weakly following the announcement that the President tested positive for Coronavirus, after retreating from Weekly Turning Line resistance. The week started well, challenging that resistance at the Turning Line (3,399) The decision by the President to halt stimulus discussions has sent the market lower in the short term. Longer term the acceptance that the Fed will keep things liquid for longer and perhaps enhanced overseas earnings if the market perceives that current Dollar strengthening is a short-lived phenomenon keeping the SPX buoyant.

SPX Daily Chart with Targets
Bullish. A powerful downside target to 2,725 still, however the downside target is outweighed by the significant upside targets, some of which look very remote.

The Dollar – DXY
A look at the Daily Cloud this time, as the short-term time frame illustrates why the DXY has struggled very recently. The DXY has entered the resistive Daily cloud from below, losing energy, and hit the 50 pct retracement of the June-September decline.
Support at 93.24 and 92.71.

AUD Weekly Cloud
Short term resistance at 0.7210 within a bullish medium-term structure. Important supports at 0.6834 and 0.6688, then 0.6463. Governor Lowe said that “policy settings will remain highly accommodative for as long as required and …continues to consider how additional monetary easing could support jobs as the economy opens up further”.
Signs of a continued rebound in the Chinese economy, with Golden Week travel numbers around 80 pct of last year’s figure, or about 17 times the population of Australia on the move and spending tourist Yuan.

The AUD Hourly Point and Figure
The AUD looks set to test (and no doubt rebound from?) support at the Weekly Standard line, currently at 0.6834. The AUD firmed today after the RBA announced no policy change in October – something widely expected but has swiftly weakened again.

Where to From Here?
The last few weeks have seen a slight recovery in inflation linked yields which has been negative for gold. Additionally, the Dollar Index technical rebound took some of the oxygen out of gold, and this process looks likely to continue if the stimulus debate continues.
The longer-term outlook for the USD might be profoundly negative of course, so this is really about the here and now and October.
Should dips in the gold and silver price play out, the macro bullish case for gold implies that these would be buying opportunities.
All target probabilities basis spot US$1875 for 3 months.
Until next time,
Nicholas Frappell
Global General Manager, ABC Bullion
Disclaimer
This article has been prepared by Australian Bullion Company (NSW) Pty Limited (ABN 82 002 858 602) (ABC). The information contained in this article or internet related link (collectively, Document) is of a general nature and is provided for information purposes only. It is not intended to constitute advice, nor to influence any person in making a decision in relation to any precious metal or related product. To the extent that any advice is provided in this Document, it is general advice only and has been prepared without taking into account your objectives, financial situation or needs (your Personal Circumstances). Before acting on any such general advice, we recommend that you obtain professional advice and consider the appropriateness of the advice having regard to your Personal Circumstances. If the advice relates to the acquisition, or possible acquisition of any precious metal or related product, you should obtain independent professional advice before making any decision about whether to acquire it.
Although the information and opinions contained in this document are based on sources we believe to be reliable, to the extent permitted by law, ABC and its associated entities do not warrant, represent or guarantee, expressly or impliedly, that the information contained in this document is accurate, complete, reliable or current. The information is subject to change without notice and we are under no obligation to update it. Past performance is not a reliable indicator of future performance. If you intend to rely on the information, you should independently verify and assess the accuracy and completeness and obtain professional advice regarding its suitability for your Personal Circumstances.
To the extent possible, ABC, its associated entities, and any of its or their officers, employees and agents accepts no liability for any loss or damage relating to any use or reliance on the information in this document.
This document may not be distributed or reproduced without consent. © Australian Bullion Company (NSW) Pty Limited 2020.