Monthly Precious Metals Technical Analysis Report - May 2020
02 June 2020
Gold – In Brief
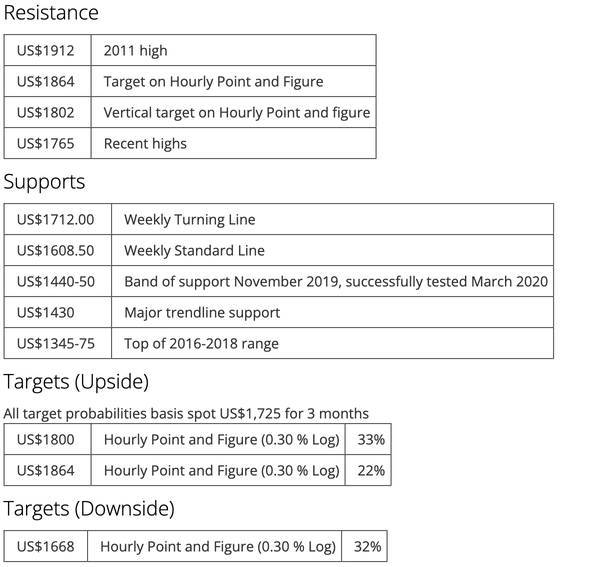
Gold spent much of the month trading in a narrowing pattern that resembled a pennant, which looked like a consolidation phase after the rapid recovery from the mid-March crash. Last week the price tested the break-out of that pattern and rallied higher, although failed to make new highs. If this break-out from the consolidation pattern follows past behaviour, then a rally to the high US$1900’s may unfold.
The principal drivers have been a deterioration in Sino-US relationships, a sharp decline in the Dollar index, rising unemployment and a contraction in economic activity more or less everywhere.
Where to from Here?
Gold is clearly bullish and has seen net inflows that are justified via an expansion of monetary and fiscal objectives driven by the economic contraction arising from COVID-19.
However, although the price is trading relatively close to recent highs activity, short-term action doesn’t feel particularly buoyant, perhaps because bullish markets ‘climb a wall of worry’.
To read the full report in PDF format, please click here.