Precious Metal Pullbacks and Buying the Dip as Turmoil Engulfs Markets
09 June 2026
Global markets suffered huge falls on Friday 5 June 2026, with equities, cryptocurrencies, precious metals and commodity indices all caught up in the turmoil.
The S&P 500, which had rallied almost exactly 20% from late March through to the start of June, was off by more than 2.5%, while the NASDAQ gave up over 4%, with some investors and analysts beginning to worry the market is at risk of repeating what we saw in the late 1990s and early 2000s: an epic tech-led rally with markets spiking to over 40 times cyclically adjusted earnings, followed by a huge crash and multi-year stock market hangover.
Bitcoin (BTC) and the broader cryptocurrency market fared no better, falling toward USD $60,000 per coin. Now down 30% YTD, BTC is once again facing the existential question that rears its ugly head in crypto bear markets: what does it really do? That uncertainty is not helped this time by the fact that Strategy (NASDAQ: MSTR)—the company that championed the cause of holding BTC as a Treasury asset—has seemingly been forced to divest a portion of their holdings, while their remaining stockpile is now underwater to the tune of about USD $10 billion.
Even gold was not immune. It sold off by over 3% on Friday, ending the first week of June trading just above USD $4,300 per troy ounce (oz), in line with its current position (10.30am AEDT on Thursday, 9 June). Silver was hit even harder, falling by 8% to USD $67.71, with the metal having now fallen by just over 40% from the high seen at the end of January 2026.
The sharp pullback in both precious metals is part of a now four-month correction that has confounded many market participants, who thought the conflict in Iran would be gold-positive, in that it would see the precious metal market continue to head higher.
Instead we have seen a significant correction, a decline in open interest on commodity futures exchanges, a return to ETF outflows, a slowdown in physical demand, and a total reset of investor sentiment—with exuberance replaced by disinterest and apathy.
This correction has now also seen gold fall back below its 200-day (200 DMA) moving average for the first time since 2023, with the 200 DMA sitting at USD $4,426 per troy ounce (oz) at the end of May.
Opportunity Presents in Periods of Uncertainty
It was easy to be a precious metal bull for all of 2025, and the first part of 2026: prices for gold, silver and platinum all surged, with gold at one point up more than 50%, while silver prices more than doubled.
There were line ups to buy physical bullion all over the world, gold ETFs were seeing record inflows, central banks were buying, and there was no shortage of analysts and market commentators forecasting higher prices.
While market sentiment has flipped 180 degrees, gold and silver arguably offer a far more compelling entry point today relative to end-January. Market history demonstrates that pullbacks such as the one we have seen in the past four months are entirely normal within the context of a now quarter-century-long secular bull market in precious metals.
For evidence of this, consider the chart below, which shows the USD spot price (gold line) of gold rising from below USD $300oz to over USD $4,300oz over this period. The black line shows how far above or below the gold spot price was trading on any given day relative to the average of the previous 200 days (200 DMA) in percentage terms.
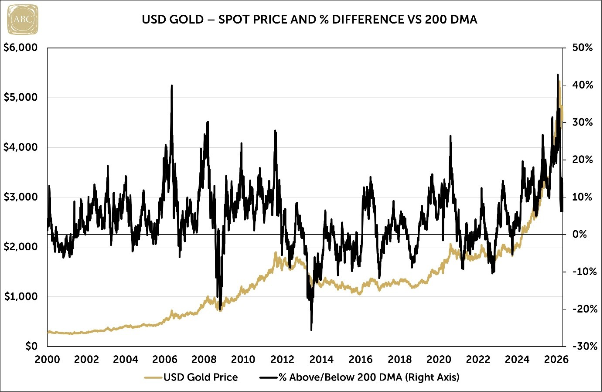
Source: ABC Bullion, LBMA
As you can see, the black line is volatile, indicating it is not uncommon for gold to oscillate between periods it is overbought (black line a long way above 0%) with these interim peaks followed by corrective periods in the market where gold ends up oversold (black line a long way below 0%).
Many of the key interim price peaks observable are also highlighted in the table below, which also shows:
The USD spot gold price at each respective interim peak;
The 200 DMA price on the day spot gold hit these interim peaks, and how far above the 200 DMA spot gold was in percentage terms;
The USD spot gold price at each interim trough, or low in the price that followed each peak;
The 200 DMA price on the day spot gold hit the interim trough, and how far below the 200 DMA spot gold was in percentage terms when the trough was hit;
The total spot price fall in both dollars and percentage terms from the interim peak to the interim trough, and;
The time it took in calendar days for the corrective period from peak to trough to play out, as well as the days to recover to that peak.
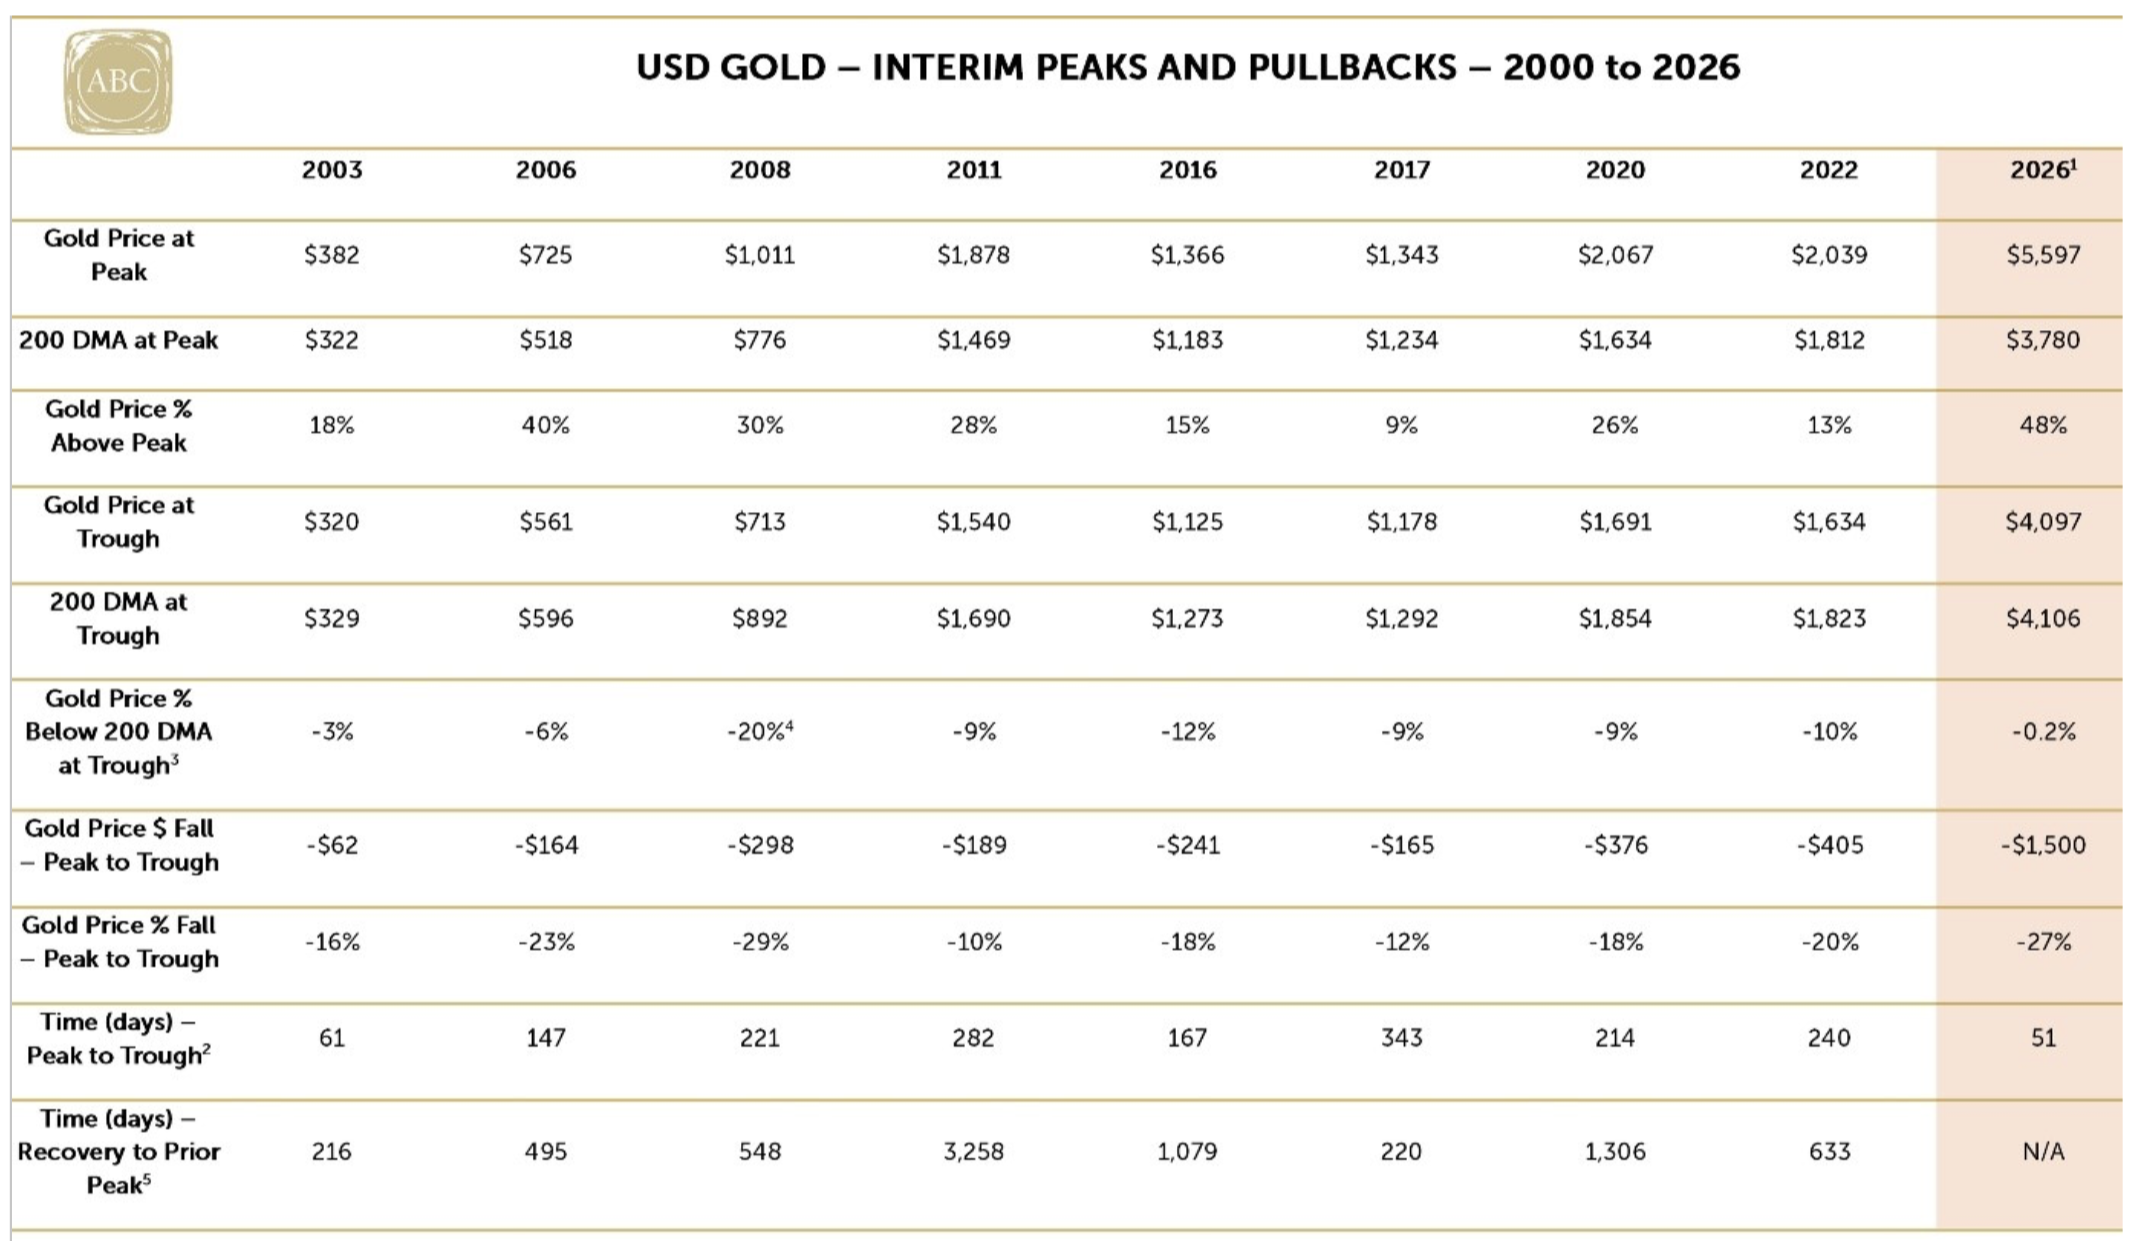
Source: LBMA, ABC Bullion
Notes: 1. Values represent pullback in current market cycle to end May 2026, with the low of $4,097 seen in late March, 2. Average historical peak to trough cycles back to is 209 days. 3. Average price % below trough is equivalent to 10% across market cycles. 4. Worst drawdown below 200 DMA. 5. Figures represent calendar days. 6. Average recovery to prior peak is 969 days.
The table makes it clear that in the periods when gold surges far above its 200 DMA and hits an interim peak, the pullback from that interim peak typically ended with gold trading below its 200 DMA.
Analysis of this data also shows that, in the corrective periods between 2003 and 2022 (current fast-evolving pullback excluded), gold:
Ended up trading 10% below the 200 DMA on the day it troughed (–8% if you took out the most extreme result);
Took 209 days to fall from peak to trough (190 days if you took out most extreme result), and;
Took on average 969 days to recover to the prior peak (642 days if you took out the most extreme result).
Given the above, we have also included the following scenario analysis, which looks at where the 200 DMA for gold may sit at the end of August this year. That timeframe would align with the average peak-to-trough time period for gold pullbacks over the last 25 years.
The great unknown of course is what will happen to the gold price from now until end-August (roughly 85 calendar days) hence the inclusions of scenarios A to F, with each using average gold prices at every $200 price point between $4,000 and $5,000oz.
The analysis also highlights what the spot price for gold may be at the end of August:
Assuming that gold is trading 10% below the 200 DMA, in line with the average price gap when the market hits the low, and;
Assuming that gold falls 20% below the 200 DMA. (This was by far the most significant pullback, seen in 2008 at the height of the Global Financial Crisis, when many equity markets dropped by more than 50%.)
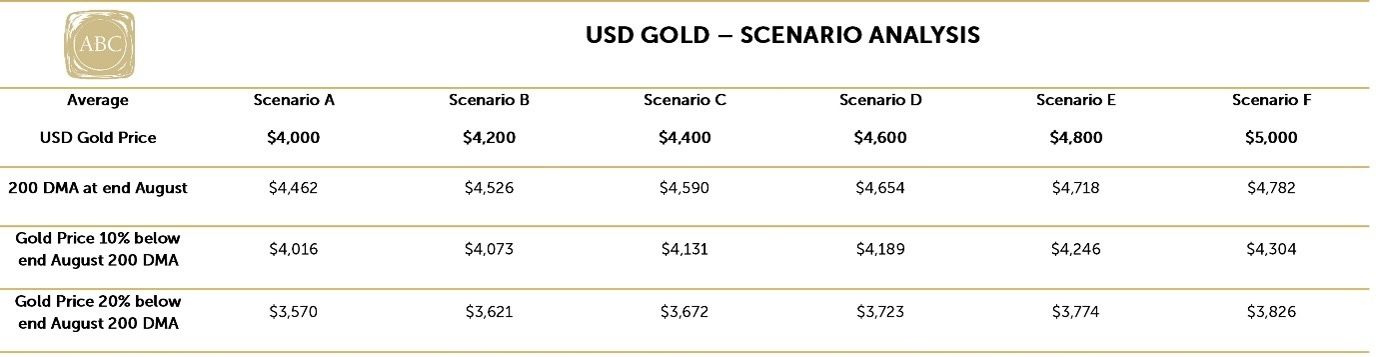
Source: ABC Bullion
The table highlights that the 200 DMA for gold is likely to be at—or even above—USD $4,500oz by end-August. If gold were to be trading 10% below that level, a spot price near USD $4,100oz would be entirely in line with historical norms.
Given that spot gold is already within 5% of that price level, we are not surprised that some clients at ABC Bullion have aggressively bought this most recent dip, adding to their positions both during weekend trade and in the first part of this week—utilising the 24/7 direct market access provided through our website.
It must be noted that investment volumes have pulled back meaningfully from the levels seen earlier in the year. This is another positive signpost for precious metal bulls, as a lull in overall activity is almost always seen at a market bottom.
Until next time.

Jordan Eliseo
General Manager, ABC Bullion

Luke Tyler
Senior Analyst, ABC Bullion
Disclaimer: This document has been prepared by Australian Bullion Company (NSW) Pty Limited (ABN 82 002 858 602) (ABC). The information contained in this document or internet related link (collectively, Document) is of a general nature and is provided for information purposes only.. Although the information and opinions contained in this document are based on sources we believe to be reliable, to the extent permitted by law, ABC and its associated entities do not warrant, represent or guarantee, expressly or impliedly, that the information contained in this document is accurate, complete, reliable or current and accept no liability for any loss or damage relating to any use or reliance on the information in this document. The information is subject to change without notice and we are under no obligation to update it.