How to understand the S&P 500 to gold ratio
15 February 2022
Tuesday 15 February 2022
To manage your email preferences, click here.
Is gold linked to equities?
Understanding the S&P 500 to gold ratio
The Standard & Poor’s 500 Index (S&P 500) is one of the world’s most widely followed equity indices, as it is believed to be one of the best representations of the US equities.
The S&P 500 is comprised of the 500 largest US corporations by market capitalisation, listed on the New York Stock Exchange or the NASDAQ Composite.
The Index was first created in 1923, but the S&P 500 in its current form began on 4 March 1957.
Is gold linked to equities?
The relationship between stock valuations and gold is widely discussed. The consensus is that gold and equities have a negative correlation; when gold falls, stocks rise, and when stocks fall, gold rises.
The reason for this inverse relationship is gold is traditionally considered a safe investment, whereas equities are generally perceived to be ‘risk on’. Gold provides a fallback for investors for when they assume a ‘risk off’ approach to their investments. When this happens, gold is more appealing than stocks. Therefore, gold is seen as a portfolio diversifier to hedge against broader market falls.
While the two assets generally move in opposite directions, there are times when gold and the S&P 500 can move together:
US dollar gold price (blue) compared to S&P 500 (orange)
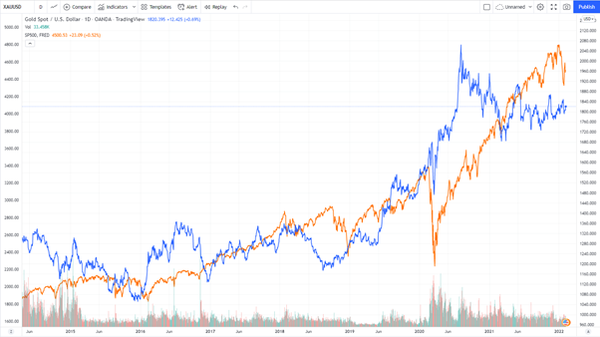
Source: Trading View
For example, both gold and the S&P 500 plunged in March 2020, however the gold price recovered much more quickly and went on to make a new all-time high in August that year.
Understanding the S&P 500 to gold ratio
Another way of analysing gold is to look at the S&P 500 to gold ratio.
The S&P 500 to gold ratio is a tool some investors use to alert them when to buy or sell physical gold.
The lower the ratio, the more expensive gold will be compared to the S&P 500. Inversely, the higher the ratio, the cheaper gold will be relative to the index.
This means that a low ratio indicates that gold is overvalued compared to stocks, whereas a high ratio indicates that gold is cheaper compared to US equities.
S&P 500 to gold ratio
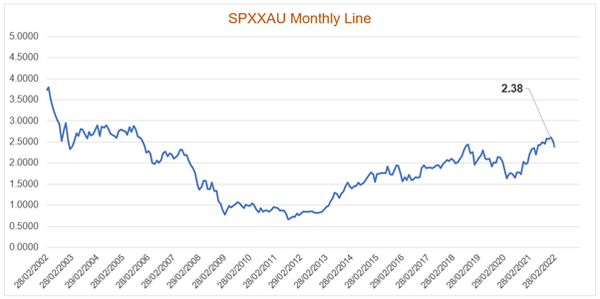
Source: Bloomberg; ABC Refinery
The S&P 500 to gold ratio is currently at its highest level since 2005. Today, it would take 2.38 troy ounces of gold to buy one ‘share’ in the S&P 500, giving the impression that gold is relatively cheap compared to US equities.
Until next time,
Shae Russell
Group Communications Manager
More from ABC Bullion
ABC Bullion Market Update
Spot gold reached its highest level overnight in two weeks as US inflation soared to a 40 year high. Fears of entrenched inflation in the US and a lack of promising signs in the recent US jobs data are leaving market watchers to speculate on just how aggressive the Federal Reserve Bank’s rate increases will be… - Learn More

How the Federal Reserve Bank are going to bungle monetary policy in 2022
Jim Rickards explains how the Federal Reserve Bank are only going to bungle monetary policy in 2022 and you should be more concerned about disinflation than inflation. Plus, the three books you need to read to be a better investor. . Watch Now
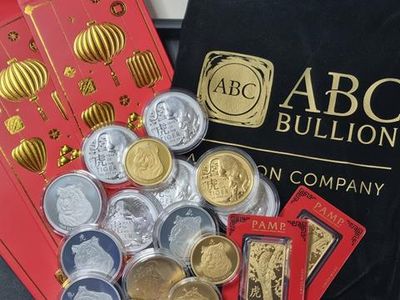
Lunar Year of the Tiger 2022
In 2022 we celebrate the third of the twelve-year cycle in the Lunar Calendar, with the Year of the Tiger.
Like their eponymous zodiac animal, people born in years of the Tiger are vigorous and ambitious, daring and courageous, enthusiastic and generous, self-confident with a sense of justice and a commitment to help others for the greater good. - Learn More